REEL LCI Version 1.0

Life cycle inventory
data for electronics

Build electronics LCAs with inventories you can inspect, from everyday components to advanced chips and packaging. Explore the inputs, outputs and modelling choices behind each dataset to understand what drives your results.

Browse documentation here. Access the datasets through Circa.

Light across a silicon waferA stylized patterned silicon wafer with slowly shifting reflections. The artwork is decorative.

From system to process

Explore the component stack

Component mapSelect a component
Server Motherboard PCB
HBM3
HBM3
3nm CoWoS IC
DDR5
3nm CoWoS IC
HBM3
HBM3
Cooling
PSU
Infrastructure
NVMe
NVMe
NVMe
NVMe
NVMe
NVMe
NVMe SSDs
Passives
PCIe Slots

Inventory documentation

Logic ICs & Wafer Fabrication

Explore wafer fabrication and packaged logic ICs, with documented process flows, boundaries, and source references.

Example datasets

Explore this category

136 datasets (48 wafers + 42 logic ICs + 46 packaging)

Documentation includes scope, flow-by-flow sources, and data quality. Access the datasets through Circa.

Built on REEL LCI

The full-stack footprint of AI, from chip to token.

Carbon of Compute turns REEL's component-level inventory into an open, interactive view of operational, embodied, facility, and training carbon across AI workloads.

Explore Carbon of Compute
v1.0 catalog

What you receive

REEL LCI v1.0 combines detailed manufacturing models into inventories for components and process nodes, available on Circa. A wafer dataset, for example, brings together its modelled fabrication steps; the Explorer documents the resulting inventory flows.

REEL provides inventory inputs and outputs. Connect background datasets and apply an LCIA method to calculate characterized impacts.

Gate-to-gate inventories: 520 datasets with direct inputs (energy, water, chemicals, gases) and outputs (emissions, waste) within each dataset's defined boundary.

Background connections: Link material and energy inputs to upstream datasets from background databases such as ecoinvent or Carbon Minds to include their production burdens.

Partially aggregated inventories: Also available with selected upstream burdens already calculated, reducing the connections you need to make by hand.

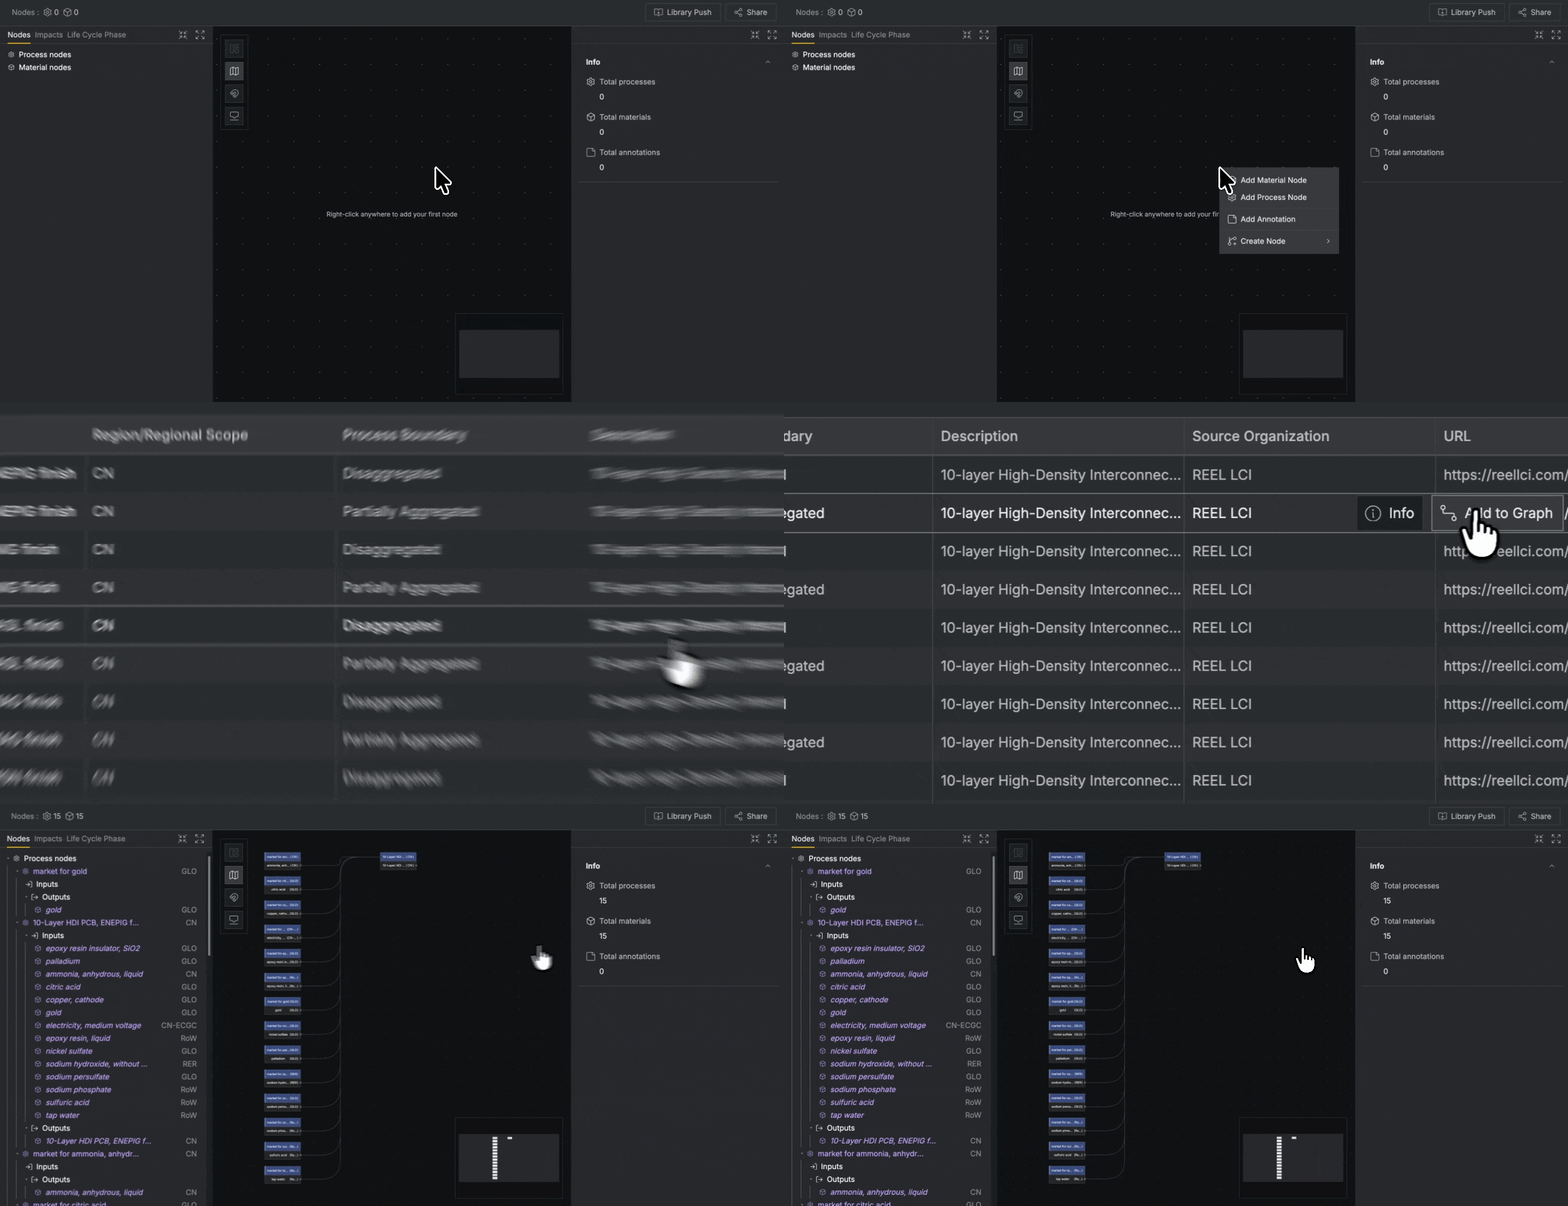
See how the data connects in Circa
Adding upstream process nodes to material inputs in Circa

Adding upstream process nodes to material inputs in Circa

Methodology Report

Full documentation of data and methods

The methodology report is informed by ISO 14040/14044 guidance and documents every aspect of the database: system boundaries, allocation procedures, data quality indicators, and sector-specific modeling approaches.

The report is intended for LCA practitioners who need to evaluate data quality, understand assumptions, and appropriately apply the inventory data in their assessments.

Independent Critical Review

Reviewed by an independent expert

The REEL LCI Database v1.0 and its methodology report, dated 21 August 2026, were critically reviewed. The review, completed August 25, 2026, assessed consistency with the guidance in ISO 14040 and ISO 14044 (to the extent they are applicable) and best practices; it did not include a verification of individual numerical values. The signed review statement is reproduced in the report as Appendix D and is available as a standalone download.

Pricing & Access

Access that fits your work

Storefront purchases are priced by dataset and datapoint. Direct licences cover broader organizational access or permission to show REEL-derived results to customers.

Storefront · Self-serve on Circa

$0.95 per credit

A dataset describes a component or process. A datapoint is the information you select: inventory quantities, an LCIA method, or properties. The dataset's tier determines its credit cost.

How credits work
Datapoint Tier 1 Tier 2 Tier 3 Tier 4
Input/output quantities 45 20 10 4
Each LCIA method 5 2 1 1
Properties 1 1 1 1

For example, Tier 4 input/output quantities cost 4 credits × $0.95 = $3.80. Other datapoints are selected separately.

Complete products and components are 1 credit per datapoint.

Supported variants are included together. For example, a 5 nm wafer dataset includes its available locations and operating or yield scenarios, while a PCB dataset includes its available surface finishes. Different physical configurations, such as 5 nm versus 7 nm or a 16-layer versus 40-layer PCB, remain separate datasets.

Academic

Quote only

Teaching and research use

  • All datasets, quantities, LCIA methods, and properties
  • Unlimited students and researchers within one department
  • Free for institutions in World Bank low- and lower-middle-income countries
Request academic access

Enterprise

Quote only

Internal use by one legal entity. Includes all datasets, quantities, LCIA methods, and properties, with no sublicensing or embedded third-party access.

Discuss enterprise access →

Developer licence

Quote only

For software companies and platforms that integrate REEL data into customer-facing products.

Discuss developer access →

Direct licences are annual. Third-party background databases and their licences are separate from REEL access.

From the author

Latest Insights

Read, apply, contribute

Resources for your work

Go deeper into the methods, explore their application, or help improve the database.

How the inventory is builtPublic sources, process models, and a deterministic calculation engine.

How It Works

The virtual factory approach

Instead of relying on proprietary facility measurements, we construct detailed inventory models bottom-up - from equipment specs, process chemistry, and publicly documented parameters.

01 – Input

Public Sources

Equipment specs, academic papers, patents, sustainability reports

02 – Model

Process Models

Per-operation inventories: energy, materials, chemicals, emissions

03 – Compute

Calculation Engine

Aggregation with uncertainty propagation, yield adjustments, allocations

04 – Output

LCI Datasets

Gate-to-gate unit process data with ecoinvent-compatible flow mapping

What the inventory tracks

Energy inputs Water consumption Material inputs Process gases Chemicals Air emissions Emissions to water Wastewater Solid waste
Applying the dataGeography, yield, production volume, and scenario selection.

Guidance for Practitioners

Always perform sensitivity analysis

Three parameters have an outsized influence on results. We strongly recommend testing your conclusions against variations in each.

Geography

Electricity grid mix is often the single largest driver of characterized impacts. A fab in Taiwan vs. Germany vs. the US can substantially shift carbon intensity depending on the grid mix used. Select the closest available regional variant, then refine the electricity input in Circa when a more specific supply-chain scenario is needed.

Yield

Yield assumptions vary by technology and maturity. Advanced nodes (3-7nm) use lower default yields than mature nodes (28nm+), reflecting publicly reported ranges. Because yield affects per-die allocation of all upstream inputs, even modest changes can meaningfully shift results - particularly for advanced packaging where stacking yields compound.

Production Volume

Facility overhead (HVAC, ultrapure water systems, abatement) is allocated across production volume. Default assumptions vary by technology maturity and available data - leading-edge fabs use published capacity figures, while mature nodes rely on industry averages. Lower utilization rates increase per-unit burdens, so the assumed scale of production matters.

REEL now includes scenario variants for key parameters, including geography, operating practice, and yield. In Circa, practitioners can select the closest available variant and make more granular adjustments directly in the platform when needed.

How AI was usedThe role of research tools and human review.

A Note on AI

How we used AI in this project

We used large language models (Claude Opus, Gemini Pro Deep Research, and GPT 5.6 Sol) extensively as a research assistant throughout the development of REEL. Here's what that means in practice.

What AI helped with

  • Collecting and synthesizing equipment specifications, patents, and academic papers across hundreds of semiconductor processes
  • Extracting quantitative data from published sources into structured YAML process files

What AI did not do

  • Generate or fabricate any data - every value traces to a documented source or explicit engineering estimate
  • Make methodological decisions - system boundaries, allocation rules, and modeling choices are human-directed
  • Perform the final LCI calculations - the deterministic Python engine handles all aggregation, yield adjustment, and unit conversion
  • Validate results without review - all outputs were checked against published benchmarks

In short: AI/LLM solutions dramatically accelerated the research and engineering work that would have taken a team of specialists many months. But the data itself comes from real, citable sources, the calculations are deterministic code, and the quality control is human. We think this is a reasonable and productive way to use the technology, and we'd rather be upfront about it.

Send data feedbackReport a missing value, inconsistency, or source.

Feedback

Help improve the database

Tell us what you think, request a dataset we don't cover yet, or flag something that looks off. Your feedback shapes what gets built and improved next.

For partnerships, citations, or other inquiries, email [email protected].

FAQ

Frequently asked questions

An LCI quantifies all the inputs (energy, water, materials) and outputs (emissions, waste) associated with a product's manufacturing. It's the data layer underneath impact assessments like carbon footprinting. REEL provides this raw inventory data - users apply their own impact assessment methods (e.g., IPCC GWP factors) to convert to characterized results like kg CO2e.

The database uses uncertainty ranges (min/typical/max) to reflect data quality. Results are validated against published fab-level benchmarks from corporate sustainability reports and academic meta-studies. Our methodology report documents a formal data quality framework with indicators for reliability, completeness, temporal relevance, and technological specificity. Where gaps exist, they are clearly flagged.

The methodology is informed by ISO 14040/14044 guidance for life cycle assessment. Elementary flows are mapped to ecoinvent nomenclature for interoperability, and emissions use standard compartment/subcompartment classifications. Waste treatment is mapped to ecoinvent activity datasets. This allows downstream users to integrate REEL data with ecoinvent background systems.

The database can support Scope 3 Category 1 (Purchased Goods) accounting for electronics by providing manufacturing inventory data for embodied impact assessments. However, REEL provides cradle-to-gate unit processes - users must connect to background datasets (e.g., ecoinvent for electricity grids and upstream materials) and apply appropriate LCIA methods for their specific supply chain geography. Users should cross-check key results against other available sources.

Default datasets assume high-volume manufacturing in the region most representative for each technology: Taiwan for advanced logic wafers, South Korea for memory, and China for PCBs and passive components. Electricity grid mixes, water treatment practices, and facility-level parameters all reflect these defaults. Production volumes assume large-scale commercial fabrication. These assumptions significantly influence results - practitioners should always evaluate whether they match their specific supply chain context.

No. A dataset bought on Circa comes with the same dataset, or its equivalent, in every version of REEL LCI: the versions before it and the versions that come after. When a new release is published, the datasets you hold are available in that release at no further charge, and the earlier versions stay available so past work can be reproduced. Each dataset carries the link to its counterpart in the other versions, so it is always clear which release a number came from.

Jonathan Balsvik

Authored by

Jonathan Balsvik

LCA practitioner focused on the electronics sector. Jonathan has delivered life cycle assessments and product carbon footprints for a range of hyperscalers and companies across the semiconductor value chain.

REEL was created to make up-to-date, component-level electronics LCI data more broadly available, supporting both industry practitioners working on product carbon footprints and academic researchers advancing the field.

Connect on LinkedIn