
1. Executive summary
Electricity is the dominant driver of greenhouse-gas emissions from AI and data centers today – the facility's power draw, and the carbon intensity of the grid behind it. But that grid is decarbonizing, and for hyperscale operators it is decarbonizing faster than the wider economy, because they procure clean power directly and at scale. As the operational footprint shrinks, the embodied emissions of the hardware – the carbon emitted to manufacture the servers, accelerators, switches, batteries, transformers, and cooling gear – become a steadily larger share of the total. The public data to model that embodied layer mostly exists, but it is scattered across many different source types, uneven in depth, and hard to navigate and consolidate – with a handful of lines where it is missing outright.
This paper is a sourcing map. Using a REEL-constructed reference architecture – one liquid-cooled AI data hall of roughly 1 MW IT load – it walks the hardware that fills the hall and asks, for each line: what is the best publicly available data to model its embodied carbon, how good is it, and where does it not exist yet?
Three findings recur:
- Compute is the largest recurring slice, and the hardest to assemble. Annualized over service life – the decision-relevant view, because IT hardware is replaced far more often than facility plant – compute is roughly three-quarters of the hall's recurring embodied carbon, and that result holds across the full range of public data. On a one-time as-built basis the margin is narrower, and whether compute or the facility power chain leads depends on an unsettled storage-inventory boundary (see §3). Within compute, the single largest line is not the accelerators but storage – petabytes of flash, whose published embodied carbon is one of the least-settled numbers in the building. And at the die level – the semiconductor content that dominates the rest – there is no public cradle-to-gate inventory at all; the most cited anchors are explicit lower bounds or rest on licensed background databases whose values cannot be republished, so this slice leans hardest on first-principles modeling. This is the slice REEL is built to anchor.
- Supporting equipment increasingly has usable environmental product declarations (EPDs) – and that is genuinely helpful. Transformers, switchgear, UPS, batteries, chillers, and cabling now carry published EPDs through the major programs; for the power and cooling chain the work is less about missing data than about finding and assembling coverage across every line. These EPDs aren't perfectly cross-comparable – different program rules, databases, and functional units – so they suit order-of-magnitude modeling better than vendor-versus-vendor ranking. But coverage is the win that matters; comparability is a caveat to manage, not a reason to discount them.
- Some lines have no public data at all. Optical transceivers, smart NICs, and the entire class of liquid-cooling hardware – coolant distribution units, cold plates, manifolds – have, as of this writing, no public embodied-carbon inventory or EPD for the hardware that we could locate (the coolant fluid is the exception). These are not modeling oversights; they are real holes in the public record, and several of them sit on the fastest-growing hardware in the building.
The rest of this paper makes those findings concrete: where the carbon sits (§3), the sourcing landscape by equipment type (§4), a one-page rip-out table (§5), and a ranked view of where better data would most move a model (§6).
2. Scope and method
The reference architecture. We model one liquid-cooled AI data hall of approximately 1 MW IT load, populated with generic, publicly-described accelerated-compute racks (an Open Compute–class 72-accelerator NVLink domain, stated vendor-neutrally), top-of-rack and spine networking, a facility power chain (UPS and batteries, power distribution, standby generation), and a direct-to-chip liquid-cooling loop (coolant distribution units and cold plates) with facility heat rejection. At current public reference densities (~124 kW/rack) that is eight racks, ~576 accelerators, ~288 host CPUs. We assume PUE ≈ 1.15 and N+1 redundancy. The full bill of materials is in Appendix A.
We use generic configurations only – no named-product bills of materials.
On scale. One megawatt is a deliberately modular unit – a single data hall, the repeatable block from which a hyperscale campus of tens to hundreds of megawatts is assembled. Working larger would not change which emission factors a model needs (a bigger facility is mostly more of the same components); it shifts their weighting. Facility-shared infrastructure – substation transformers, standby generation, switchgear – is amortized across far more IT at campus scale, so its embodied share falls per unit of compute, while networking and optics, which grow faster than linearly with cluster size, rise. A larger AI data center therefore tilts the embodied split even further toward the compute and networking hardware this paper concentrates on; the per-line sourcing task is the same, only its emphasis moves.
Boundary – in scope. The embodied (cradle-to-gate, manufacturing) burden of the hardware itself: IT hardware (compute, networking and optics, racks and in-rack power) and supporting equipment (the power chain and the cooling system, both liquid and the residual air system).
Boundary – out of scope. Core and shell, the long-tail of building services, and operational flows. These are not ignored – they are addressed in the box below, because each is better covered elsewhere than it would be here.
Metric. We discuss embodied global warming potential only, and we report it as relative shares, not absolute mass. Broader categories (water, acidification, toxicity) and the absolute inventory live in the REEL LCI Methodology Report and the underlying datasets. Reporting shares keeps the focus on where the data problem is, which is the point of the paper, and avoids implying a false precision the public data does not support.
What we excluded, and why
These are deliberately out of scope for this paper because public data already covers them well – not because they don't matter.
- Core & shell (concrete, structural steel, rebar, envelope, raised floor) – large, but well-served by building-LCA registries such as EC3 / Building Transparency, and outside REEL's lane.
- Long-tail building services (fire suppression, building-management controls, security, lighting) – excluded under standard LCA cutoff criteria: small contribution, high enumeration cost.
- Grid electricity – operational, and readily available as national/regional emission factors from many public providers.
- On-site and embedded water – best modeled with a regional or local water dataset from any database provider; the subject of a forthcoming REEL water paper.
- Standby-generator fuel combustion – operational; available from public fuel-cycle datasets.
3. The reference hall and where the embodied carbon sits
Building the hall bottom-up – multiplying the bill of materials by the best available public per-component data – produces the two views in Figures 1 and 2. They are not co-equal: the annualized view (Figure 2) is the one to trust, for the reasons below.
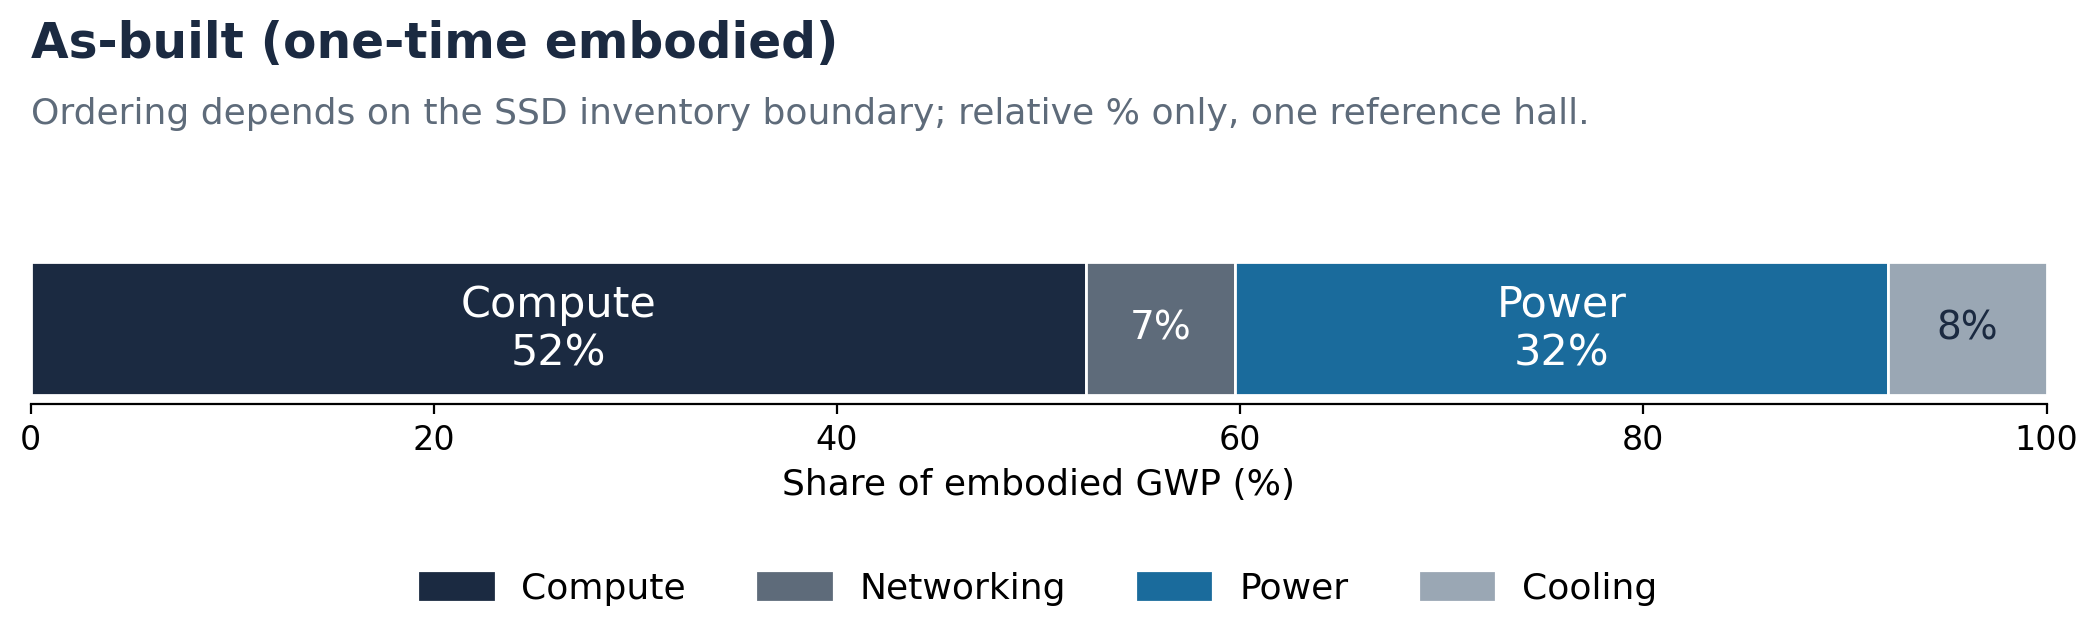
Figure 1. As-built (one-time embodied). Illustrative split for the reference ~1 MW liquid-cooled AI data hall; relative shares only, wide uncertainty. The facility power chain is fully allocated to the single hall (a deliberate worst case), and the compute/power ordering here depends on the storage-inventory boundary (below).
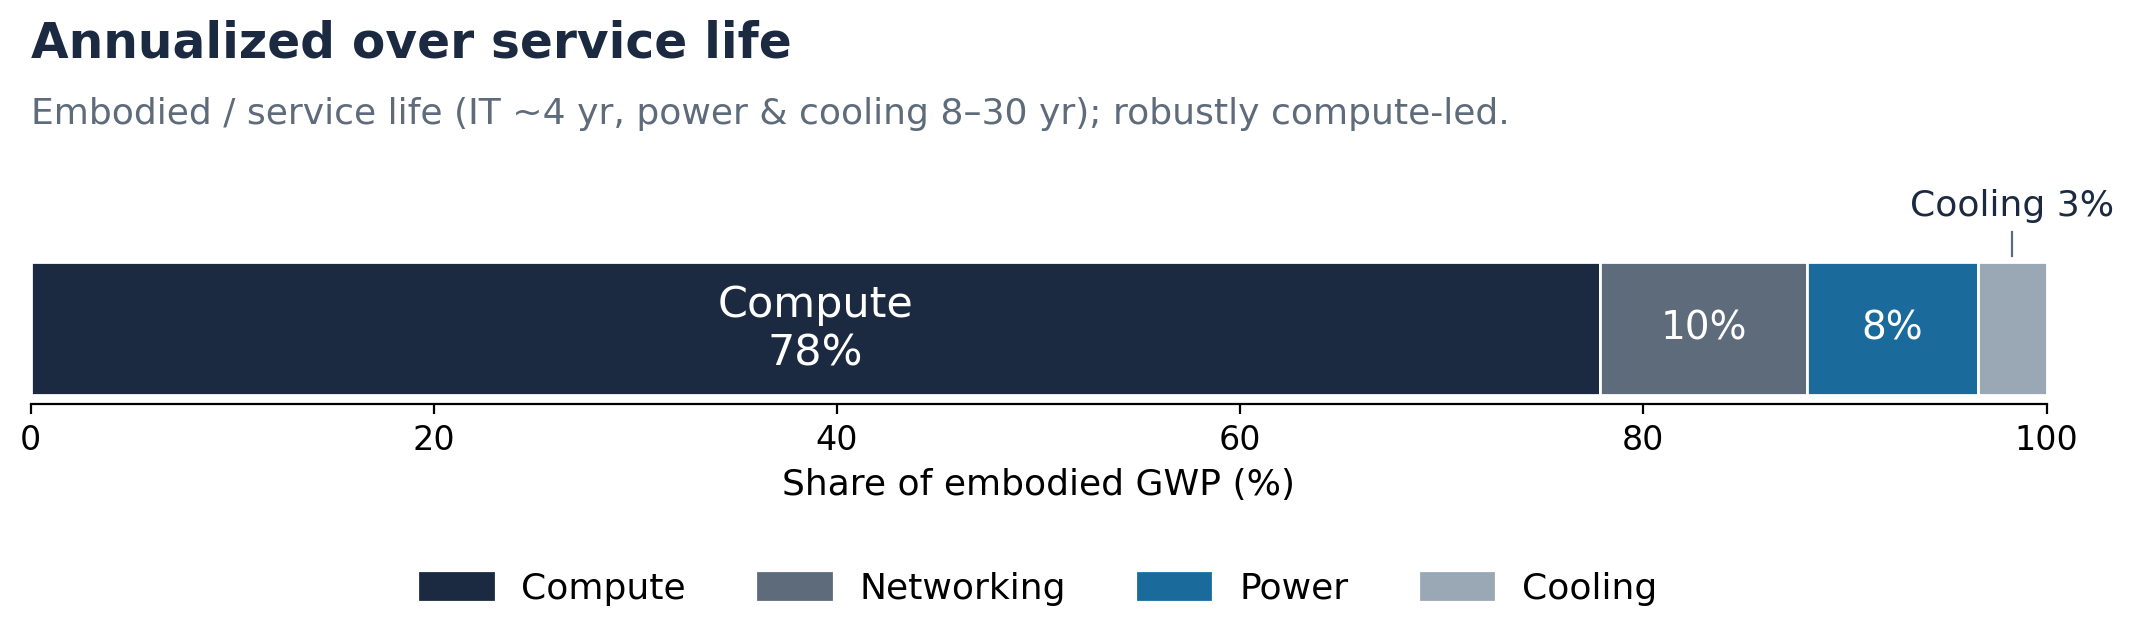
Figure 2. Annualized over service life. The same hall, with each line's embodied carbon divided by its service life – the decision-relevant view, and the one whose ordering is robust. See Appendix A for the bill of materials and per-line basis.
The annualized view is the load-bearing one. IT hardware is replaced every three to five years; facility power and cooling plant last anywhere from eight to thirty. Dividing each line's embodied carbon by its service life – the view an operator actually faces when planning refresh cycles – puts compute at roughly three-quarters of the recurring embodied burden, with networking, power, and cooling each in the single digits to low double digits. Crucially, this ordering holds across every reasonable assumption we tested: even at the most compute-unfavorable storage boundary it stays around two-thirds, and at the other it rises above 80%. The faster the refresh, the more the silicon dominates – and the refresh is fast.
The as-built view is closer, and storage is why. On a one-time basis, compute is about half the total and the facility power chain is large – roughly a third – because transformers, switchgear, the standby generator, and the UPS are metal- and copper-heavy and, here, fully allocated to one hall (a worst case; spread across a multi-hall facility the per-hall power share would be smaller). And the compute total is not carried by the accelerators the prose tends to emphasize: the single largest line in the whole hall is storage – petabytes of NVMe flash. The embodied carbon of that flash is among the least-settled numbers anywhere in the model: a 1 TB enterprise solid-state drive (SSD) has a published embodied value that ranges roughly five-fold depending on whether the inventory boundary is bare NAND die (lower) or the finished drive (higher) (the ACT model, 2022; Tannu & Nair, 2022). That single boundary choice decides the as-built ordering:
| SSD inventory boundary | Compute (as-built) | Power (as-built) | Compute (annualized) |
|---|---|---|---|
| Bare NAND die (ACT) | ~37% | ~43% – power leads | ~66% |
| Illustrative midpoint | ~52% | ~32% | ~78% |
| Finished drive (Tannu & Nair) | ~61% | ~27% | ~83% |
So as-built, whether compute or power leads is genuinely boundary-dependent – a skeptical reader who picks the bare-NAND boundary (a legitimate, peer-reviewed, fully public choice) will find power ahead, and we do not paper over that. What is robust is the annualized ordering, which keeps compute first under every boundary, because power's long service life dilutes its one-time burden no matter how storage is counted. Treat the as-built split as context; treat the annualized split as the finding.
(A note on sensitivity: applying the low and high anchors to every line in lockstep barely moves the shares – but that correlated case is not a real robustness test. Allowing the lines to vary independently, the worst case for compute as-built (compute lines low, power lines high) sends power clearly ahead. This is precisely why we rest the conclusion on the annualized view, not the as-built one.)
On cross-checking – and why we build bottom-up. There is no public data-center LCA that reports component-level embodied carbon to validate this split against, and that absence is itself the finding. The most complete public whole-system studies – led by a hyperscale cradle-to-grave assessment from Microsoft and WSP (Alissa et al., Nature, 2025), alongside a handful of academic data-center LCAs – report only system totals on licensed background databases; their own equipment inventories cover chillers, busways, PDUs, transformers, UPS, and generators but include no cooling hardware and no semiconductor-level inventory. Where they comment on the layer we model, they reach the same conclusion from the top down: the Microsoft/WSP study finds the use phase largest and server embodied carbon second, while flagging its own electronics inventory as roughly two decades old and rating its data quality three out of five. In other words, the most authoritative public picture of a data center confirms both that the embodied hardware layer matters and that the public data to model it at component resolution is scattered and, in places, absent – which is exactly why this paper assembles it line by line from primary public sources.
The grid-carbon dependence is itself instructive. A real-world assessment of a hydropowered Swedish data centre – in effect, a preview of a fully decarbonized grid – finds server embodied carbon at roughly four-fifths of annual climate-change impact, with a further 60%-plus cut available simply by extending server life from three to five years (Borisová & Vesterlund, 2025). On today's grid mixes operational energy still leads; the cleaner the grid, the more the picture tilts toward exactly the embodied hardware this paper maps.
4. Sourcing landscape by equipment archetype
Each block below follows the same structure: where it shows up in the hall, why it matters, the current best public source with its provenance label, and the data-quality flags. Provenance labels are defined in Appendix B.
4.1 Compute – servers, CPU, GPU/accelerator, HBM + DDR, SSD, NIC, board
- Where it shows up
- The dominant embodied slice, in every rack.
- Why it matters
- The burden is silicon-dominated. A leading accelerator vendor's own product carbon footprint attributes roughly 90% of an 8-GPU baseboard to materials and components, with high-bandwidth memory (HBM) the single largest component block (vendor PCF; licensed background, headline split only). An open hardware-impact aggregator points the same way (most of a server's manufacturing GWP sits in the die), with the caveat that its worked example is memory-heavy and it disclaims cross-device comparison.
- Best public source
- Mostly REEL-modeled, with two useful public cross-checks. No unrestricted public cradle-to-gate inventory exists at the die or package level, but IMEC's netzero virtual-fab tool, now offered in a public as well as a private version, gives a bottom-up estimate for logic and memory wafers and dies that can sanity-check the semiconductor content. For storage (SSDs) the best public anchor is the peer-reviewed aggregate of ~94 drives in Tannu & Nair, because no storage vendor publishes a detailed, usable per-product SSD footprint. What exists is sparse and inconsistent: Samsung holds Carbon Trust PCF labels (single certified numbers) for a few memory and SSD products, most vendors disclose only sustainability-report figures, and Seagate withdrew its per-product Nytro footprints (its 2025 "Decarbonizing Data" report, claiming hard drives beat SSDs on embodied carbon, was publicly disputed by flash vendors). That contested, label-only picture is itself the finding. The ACT model is a self-described lower-bound cross-check for logic and memory.
- Flags
- The hardest spots, even within this well-studied archetype, are HBM per-GB, NIC/DPU embodied carbon, and the storage inventory boundary (see §3): the bare-NAND-versus-finished-drive choice that swings the storage line about five-fold, and the as-built split with it.
4.2 Networking & optics – switches, transceivers, DAC/AOC, cabling
- Where it shows up
- Scales with the rack-scale fabric; optics are by far the most numerous active part. Counting both ends of every fabric link, the reference hall carries on the order of a few thousand transceivers (roughly one server-side module per accelerator, plus the leaf and spine tiers counted at both ends).
- Why it matters
- That count makes optics a meaningful slice despite each module's small mass, and the embodied hotspot of a modern transceiver is its advanced-node DSP ASIC, only visible bottom-up.
- Best public source
- REEL-modeled for the active optics, vendor EPD for cabling. REEL already models optical transceivers, active and passive cables, and switch silicon at component level, which matters because there is no public per-unit embodied-carbon inventory for transceivers, direct-attach copper or active optical cables, co-packaged optics, or optical circuit switches anywhere (the single clearest gap in this archetype). Switch chassis can be anchored to a small number of vendor product carbon footprints, but with a wide uncertainty band, a streamlined method (not EN 15804), and, for the only one we located, a storage-area-network rather than Ethernet form factor, so treat it as order-of-magnitude only. Structured copper cabling, by contrast, has genuine EN 15804 EPDs with a usable per-meter figure.
- Flags
- The active-optics gap is real and growing; REEL's transceiver and cable models are, as far as we can tell, the only component-level numbers available.
4.3 Racks, busways & in-rack power
- Where it shows up
- Every rack; broad but modest per unit.
- Why it matters
- Steel and aluminium frames plus copper busbars, a materials line rather than a silicon line.
- Best public source
- Mass × public metal intensity. Realistic masses come from REEL's own rack and busbar models; cradle-to-gate metal intensities come from the metals associations (steel, aluminium, copper) and peer-reviewed metal LCAs, with a generic ecoinvent dataset as the practical pointer (named, not valued).
- Flags
- The dominant uncertainty is sourcing, not the per-unit factor; primary versus recycled metal, and the undisclosed steel route of the original-design manufacturer, can swing the result several-fold. Row-level busway is a small public gap.
4.4 UPS + batteries
- Where it shows up
- The facility power room; N+1 on a roughly 1 MW base.
- Why it matters
- The battery is the embodied hotspot of the energy-storage line, and chemistry matters.
- Best public source
- Public LCI for the battery, vendor EPD for the UPS. The battery is one of the best-covered lines in the whole building: cell-level cradle-to-gate carbon for lithium-ion chemistries (NMC, LFP) appears across many public sources that converge within a reasonable band – peer-reviewed inventories (Peiseler 2024; Fett 2022), a fully public GREET-based inventory (Dai 2019), agency datasets, and the wider battery-LCA literature. The UPS power-electronics unit is best anchored to a vendor EPD.
- Flags
- Always state the battery boundary; a bare cell, a pack with its management system (~10–30% more), and a full energy-storage system with inverter and balance-of-plant (roughly three-fold the cell) are three different numbers, a boundary difference rather than a data conflict. UPS EPDs are comparable only to other EPDs under the same program.
4.5 Power distribution – transformers, switchgear, PDUs, gensets
- Where it shows up
- Facility-shared electrical, upstream of the racks.
- Why it matters
- Copper- and steel-intensive, and, on an as-built basis, a large share of hall embodied carbon (a share that falls at campus scale, as facility-shared plant amortizes over more IT).
- Best public source
- Vendor EPD / industry registry. This is the most EPD-covered segment of the whole map: transformer, switchgear, and cabling EPDs are published through EPD International, EPD Italy, and PEP ecopassport, and through manufacturer portals, so assembling a defensible estimate for this chain is mostly a matter of finding the right declarations.
- Flags
- The numeric anchors rest on licensed background databases (headline-usable, sub-values not), and the EPDs aren't perfectly cross-comparable (different program operators, product category rules, declared units) – fine for order-of-magnitude modeling, less so for ranking vendors, and not a reason to set them aside. The standby generator is the segment's biggest hole: essentially no manufacturer embodied EPD, with the only public figure coming from a single peer-reviewed study of a much smaller unit, scaled here to data-center size by mass. A marketed "SF₆-free, GWP < 1" switchgear claim refers to the insulating gas, not embodied carbon.
4.6 Air / facility cooling – chillers, CRAH, heat rejection
- Where it shows up
- Even a liquid-cooled hall retains a residual air system and a facility heat-rejection plant. Current direct-to-chip designs send roughly 85–90% of rack heat to the liquid loop (our reference uses ~87%, an HPE-disclosed split; vendor claims span a wider ~70–98%), leaving the rest to air.
- Why it matters
- Facility-shared mechanical equipment, much of it steel and copper, plus an embedded refrigerant charge.
- Best public source
- Vendor EPD for chillers (including at least one data-center-specific air-cooled chiller EPD); method-plus-mass for the rest.
- Flags
- Chiller EPDs are licensed-background and not cross-comparable; CRAH units and cooling towers have no product-specific EPD and, for towers, no verified peer-reviewed LCA, so they must be estimated from mass and a building-services method (CIBSE TM65), which itself spans a wide intensity range.
4.7 Liquid cooling – CDUs, cold plates, manifolds, coolant
- Where it shows up
- The defining hardware of the reference architecture, and the newest.
- Why it matters
- It is growing faster than anything else in the building.
- Best public source
- REEL-modeled; no public per-component data exists. This is the headline gap: we could locate no public cradle-to-gate inventory or EPD for any liquid-cooling hardware line – not coolant distribution units (CDUs), cold plates, manifolds, or quick-disconnects. The Microsoft/WSP Nature (2025) study gives useful system-level indications for liquid cooling (it finds cold-plate and immersion designs cut operational GHG, energy, and water versus air) but publishes nothing on a per-component basis, and its own supplement lists EPDs for chillers, busways, PDUs, transformers, UPS, and gensets but zero for cooling hardware. REEL already carries a fair amount of this class – manifolds, quick-disconnects, cold plates, and CDUs modeled from mass and first principles (copper- and stainless-heavy, with forming and brazing energy on top of the material floor) – which makes REEL effectively the only line-item source here. The coolant fluid is the public exception: propylene-glycol mixtures have a published chemical inventory, while immersion/dielectric fluids remain a gap, compounded by the ongoing withdrawal of PFAS-class fluids.
- Flags
- Cold-plate copper mass per chip and in-rack CDU mass are the least-grounded inputs anywhere in the model.
4.8 Refrigerant leakage (fugitive GWP)
- Where it shows up
- The facility chillers only; a liquid-cooling loop carries no refrigerant, and a chiller-free heat-rejection design carries none at all.
- Why it matters
- Not equipment manufacturing, but a recurring, hardware-linked emission with very high GWP per kilogram.
- Best public source
- A method, not a product factor. Refrigerant GWP values (IPCC AR6), charge intensity per kW of cooling, and annual leakage-rate ranges are all public and standardized (IPCC, EPA); the fugitive contribution is charge × leakage rate × GWP.
- Flags
- The dominant lever is refrigerant choice (three orders of magnitude between a high-GWP HFC and a low-GWP HFO or natural refrigerant), then leakage rate, then end-of-life recovery; data-center life cycle studies routinely omit this line entirely.
5. The sourcing table
One page, sized to be circulated. The table records what kind of data exists for each line and where it falls short – not emission-factor values, which for most lines would either be licensed or falsely precise.
| Hardware line | Archetype | Recommended public source | Type | Vintage | Public-data gap |
|---|---|---|---|---|---|
| GPU / accelerator + HBM | Compute | REEL model; cross-check IMEC netzero, NVIDIA HGX PCF (headline) | REEL-modeled | REEL v1.0 | No public die-level LCI; HBM per-GB unquantified |
| CPU package | Compute | REEL model; cross-check ACT, IMEC IEDM | REEL-modeled | REEL v1.0 | No public CPU-package PCF |
| DRAM (system) | Compute | ACT model | Public LCI | 2022 | Per-GB by node generation |
| SSD / NVMe | Compute | Tannu & Nair (94-drive aggregate) | Public LCI | 2022 | 5× die-vs-drive boundary; vendor PCFs withdrawn |
| NIC / DPU | Compute | REEL model | REEL-modeled | REEL v1.0 | No public LCI; no applicable PCR |
| Server board + PSU | Compute | REEL model; cross-check UBA Green Cloud | REEL-modeled | REEL v1.0 | No low-loss AI-board LCI |
| Leaf / spine switch | Networking | Cisco PCF (SAN-switch proxy) | Vendor PCF | 2025 | No 400/800G Ethernet switch EPD |
| Optical transceiver | Networking | REEL model | REEL-modeled | REEL v1.0 | No public per-module LCA anywhere |
| DAC / AOC cable | Networking | REEL model (build-up) | REEL-modeled | REEL v1.0 | No public per-unit LCA |
| Structured cabling | Networking | EN 15804 EPDs (per metre) | Vendor EPD | 2022 | Fibre trunks / connectors thinner |
| UPS unit | Power | ABB HiPerGuard EPD | Vendor EPD | 2021 | No vendor-neutral benchmark |
| Battery (Li‑ion) | Power | Peiseler 2024, Dai 2019 / GREET | Public LCI | 2019–24 | Cell→cabinet uplift |
| Transformer | Power | Matelec EPD (EPD Italy) | Vendor EPD | 2022 | No dry-type / DC-specific EPD |
| Switchgear | Power | ABB UniSwitch EPD | Vendor EPD | mixed | No modern LV data-center switchboard EPD |
| Floor PDU | Power | Vendor PEP build-up (component) | Vendor EPD | 2020s | No integrated PDU EPD |
| Standby genset | Power | Benton 2016 (mass-scaled) | Public LCI | 2016 | No OEM embodied EPD; biggest power gap |
| Facility cabling | Power | Prysmian cable EPD | Vendor EPD | 2025 | No defensible generic tonnage |
| Chiller | Cooling | Carrier 19DV EPD (+ Trane GVAF) | Vendor EPD | 2024 | None on a public background DB |
| CRAH | Cooling | CIBSE TM65 + mass | Method + mass | 2020/24 | No CRAH-specific EPD |
| Cooling tower / dry cooler | Cooling | Public metal LCA + mass | Method + mass | metals 2023 | No EPD, no verified tower LCA |
| Pumps / piping / valves | Cooling | Public metal LCA + mass | Method + mass | metals 2023 | Mass take-off is the gap |
| CDU | Cooling | REEL model (from mass) | REEL-modeled | REEL v1.0 | No public LCI / EPD |
| Cold plate | Cooling | REEL model (from mass) | REEL-modeled | REEL v1.0 | No public mass or LCI |
| Manifold / UQD / hose | Cooling | REEL model (from mass) | REEL-modeled | REEL v1.0 | No supplier LCA |
| Coolant (PG) | Cooling | Nachtergaele 2019 | Public LCI | 2019 | Immersion / PFAS fluids are a gap |
| Refrigerant leakage | Cooling | IPCC AR6 (GHG Protocol) + EPA method | Method pointer | 2019–24 | No DC-specific empirical leak rate |
Reflects best-available public data as of June 2026. Vintage and the public-data gap refer to the recommended public source and the public landscape, not to REEL. Rows marked "REEL v1.0" are anchored by the REEL database where no usable public source exists, and the gap states what public data is missing. EPD rows are individually sound but not perfectly cross-comparable (see §7); registry pointers are living, and named examples are an "as-of" snapshot. Full citations in §9 References. Source-type definitions in Appendix B.
Where the licensed data is
This paper maps the public data. For completeness, the main commercial and licensed databases that also cover this space – usually combined with public anchors in a full model – are:
- Sphera (LCA for Experts): an electronics extension database plus metals datasets; the most electronics-specific licensed coverage.
- ecoinvent: limited electronics (a few cable and connector datasets), but strong, widely used datasets for water, electricity, and metals.
- IMEC netzero: a free fab model, with most detailed content behind a paywall.
- TechInsights: product carbon footprints derived from their cost-based fab model.
REEL's role is to add unaggregated, line-item coverage where these are thin or absent, not to replace them.
6. Where better data would move the needle
A ranked, qualitative leverage list – for a sustainability lead deciding where one data project would do the most good.
Tier 1 – highest leverage (top contributors that are also poorly sourced)
- Compute / semiconductor embodied carbon – the largest slice, and at the die level a genuine public gap (vendor PCFs exist, but on licensed backgrounds). This is REEL's anchor; peer-reviewed die-level inventories or unrestricted disclosure would move every downstream model. High-bandwidth memory per-GB is the sharpest sub-gap.
- Liquid-cooling hardware (CDUs, cold plates, manifolds) – a complete public gap on the fastest-growing hardware class. A single credible peer-reviewed inventory or supplier EPD would be field-defining.
- Optical transceivers – numerous, silicon-heavy, and entirely unsourced publicly.
What would help: peer-reviewed cradle-to-gate inventories, or supplier EPDs that disclose the silicon and substrate content rather than only the enclosure.
Tier 2 – high leverage (usable EPDs exist; the win is completing coverage)
- Power-distribution and UPS EPDs (transformers, switchgear, UPS, batteries). Usable declarations already cover much of this chain – the leverage is filling the lines that still lack one (notably the standby generator) and, secondarily, harmonizing product category rules so the EPDs that exist become more comparable (the EN 50693 family is the convergence point to watch). What would help: EPDs for the missing lines, plus disclosure of background-database and boundary choices so models can normalize the ones that exist.
Tier 3 – broad exposure (small per unit, but everywhere)
- Structural metals (racks, busways, and facility cabling – the last classified under Power in the §5 table, but sharing the same metals-sourcing story) – well-handled by metals-association data and EPDs; the leverage is in stating the sourcing scenario (primary vs recycled).
- Refrigerant-leakage accounting – small in a well-designed liquid-cooled hall, but routinely omitted; the leverage is discipline, not new data.
7. EPDs, comparability, and the registry approach
Two practical cautions for anyone assembling a model from the table above.
Point to living registries, not a frozen list. EPDs expire – typically on a five-year cycle – so any static list of specific declarations begins rotting the day it is published. For the EPD-covered lines (power distribution, chillers, cabling), the durable advice is to pull current declarations from the relevant registry (EPD International / Environdec, PEP ecopassport, EPD Italy, and manufacturer portals) and to record the as-of date. Named examples in this paper are an explicit snapshot, not a recommendation to use those exact declarations indefinitely.
Use what's published; don't wait for perfect comparability. Two EPDs for nominally similar equipment are usually not perfectly cross-comparable: they may follow different product category rules, use different background databases, declare different functional units, and apply different life cycle impact methods. That is worth knowing, but it is not a reason to set the data aside – each EPD is a legitimate order-of-magnitude input for the product it describes, and assembling coverage across every line of the power and cooling chain is far more valuable to a model than holding out for a handful of perfectly comparable declarations. Use them as inputs, carry the uncertainty, and don't rank vendors on EPD headline numbers alone. A short selection checklist:
- Does the product category rule match the equipment class (and is it current)?
- Is the background database disclosed?
- Is the system boundary stated (cradle-to-gate vs cradle-to-grave; what's in A1–A3)?
- Is the declared/functional unit one you can convert to your model's basis?
- What is the vintage, and is the declaration still valid?
If two declarations disagree after you have normalized for those five things, that disagreement is real information about uncertainty – carry it, don't average it away.
8. Limitations and open questions
- Embodied GWP only. Operational electricity and water are excluded by design (better covered elsewhere; water is a forthcoming REEL paper), and only global warming potential is treated – not water scarcity, acidification, or toxicity.
- One reference architecture. A single ~1 MW liquid-cooled AI hall; air-cooled, enterprise, and edge topologies would shift the split, and a next-generation ~1 MW-per-rack design will shift the bill of materials.
- Illustrative shares. Figures 1 and 2 are built from public per-unit anchors with wide uncertainty and a deliberate facility-allocation choice (full allocation of shared electrical plant to one hall). The shares are directional, not a measurement.
- A moving EPD landscape. Named declarations are an as-of-June-2026 snapshot.
- Provenance-tracked sourcing. Every figure's source, vintage, and licensed-background status is recorded in the companion source pool; a few single-source or proxy-retrieved anchors are tracked there for primary-source confirmation as declarations are reissued.
9. References
Public sources only. Vendor EPDs and PCFs rest on licensed background databases and are cited at the headline level; their sub-values are not reproduced. REEL-modeled lines are built from the public sources below plus REEL's own line-item inventory.
Compute & semiconductors
- Gupta et al., "ACT: Architectural Carbon Modeling Tool," ISCA 2022. PDF
- Tannu & Nair, "The Dirty Secret of SSDs: Embodied Carbon," HotCarbon 2022. PDF
- Garcia-Bardon et al. (IMEC), "DTCO including Sustainability," IEDM 2020 – and the imec.netzero virtual fab (public version). IEEE · imec
- NVIDIA, "HGX H100 Product Carbon Footprint Summary" (headline figures only). PDF
- German Environment Agency (UBA), "Green Cloud Computing," TEXTE 94/2021. PDF
- Boavizta, open hardware-impact dataset & method. link
- Seagate, "Decarbonizing Data" report (2025), and the flash-vendor rebuttal (Pure Storage / Solidigm / Ocient). report · rebuttal
Networking & optics
- Cisco environmental impact reports (the only public switch PCF; SAN-switch form factor). link
- EN 15804 datacom-cabling EPDs, via EPD International / Environdec. link
Batteries & UPS
- Peiseler et al., Nature Communications 2024 (cell-level Li-ion LCI). DOI
- Dai et al., Batteries 2019 (GREET, fully public background). DOI
- Fett et al., J. Industrial Ecology 2022 (system-level battery LCI). DOI
- ABB HiPerGuard MV UPS, PEP Ecopassport EPD. PDF
Power distribution
- Matelec 1000 kVA distribution transformer EPD (EPD Italy, EN 50693). PDF
- ABB UniSwitch MV switchgear EPD. PDF
- Benton, standby-generator LCA, Montana Tech thesis 2016 (mass-scaled to data-center size). link
- Prysmian LV copper building-wire EPD (UL Solutions, 2025). PDF
Metals (intensity anchors)
- Public eco-profiles: worldsteel (steel), International Copper Association, International Aluminium Institute; Nuss & Eckelman (peer-reviewed copper). worldsteel · ICA · IAI
Cooling & refrigerants
- Carrier AquaEdge 19DV chiller EPD (NSF), with Trane GVAF data-center chiller EPD. PDF
- CIBSE TM65, embodied carbon of building-services equipment. link
- Nachtergaele et al., propylene-glycol LCI, J. Chem. Tech. & Biotech. 2019. DOI
- IPCC AR6 GWP values (via GHG Protocol, 2024); EPA fugitive-emissions method. GWP · EPA
Whole-system data-center LCAs (context; none at component resolution)
- Alissa et al. (Microsoft / WSP), "Using life cycle assessment to drive innovation for sustainable cool clouds," Nature 2025. open access
- Borisová & Vesterlund, "Assessing the environmental impact of operating a Swedish data centre in subarctic climate," J. Cleaner Production 2025 (open access). link
- Bux et al., "A critical analysis of GWP of data centers in the digital era," Int. J. Life Cycle Assessment 2025. DOI
- Wadenstein & Vanderbauwhede, "Life cycle analysis for emissions of scientific computing centres," EPJ C 2025. arXiv
REEL & out-of-scope pointers
- REEL LCI Methodology Report v1.0 (to be published) – inventory construction and the data-quality scheme (the absolute basis behind this paper's relative shares).
- EC3 / Building Transparency – for the out-of-scope core & shell. link
Appendix A – Reference-hall bill of materials
A generic, vendor-neutral reference (as-of 2025–26). The full bill of materials, per-line public anchors, and service-life assumptions sit behind the calculation; the summary of archetype shares (central, illustrative) is:
| Archetype | As-built share | Annualized share |
|---|---|---|
| Compute | ~52% | ~78% |
| Power | ~32% | ~9% |
| Cooling | ~8% | ~3% |
| Networking | ~7% | ~10% |
As-built shares are SSD-boundary-dependent (see §3); annualized shares are robust to it.
Where REEL anchors vs. points elsewhere – REEL's contribution concentrates where public data is absent and the burden is silicon-bearing:
| Archetype | REEL's role |
|---|---|
| Compute (accelerators, memory, storage, NIC/DPU, boards) | Anchor – REEL-modeled; no public die-level LCI |
| Networking (transceivers, switch ASICs) | Anchor for silicon-bearing lines; point to EPDs for cabling |
| Liquid cooling (CDU, cold plate, manifold) | Anchor – modeled from mass; a complete public gap |
| Racks & structural metals | Point to metals-association data / EPDs |
| Power distribution, UPS & batteries | Point to vendor EPDs and public battery LCI |
| Air cooling, refrigerant leakage | Point to vendor EPDs and public methods |
Appendix B – Provenance taxonomy
- REEL-modeled – built from public sources because no usable public LCI exists; REEL is the recommended source.
- Public LCI – an open, peer-reviewed inventory exists.
- Vendor EPD / PCF – a manufacturer declaration exists; carries the non-comparability caveat of §7.
- ecoinvent-pointer – a pointer to an ecoinvent dataset name for downstream linking; no values reproduced.
- Industry registry – a living registry rather than a single frozen declaration.
- Method + mass – no product-specific source exists; the line is estimated from component mass and a public material or building-services method (e.g. metals-association cradle-to-gate intensities, CIBSE TM65).
- Method pointer – not a product factor at all, but a public calculation method (e.g. the IPCC / EPA refrigerant-leakage equations).
- No public source (gap) – pure modeling required; these are the paper's headline findings.
REEL LCI builds line-item environmental inventory for electronics from public information. This paper maps where that information is strong, where it is thin, and where REEL fills the gap. Comments welcome.